
Personalization has become an essential part of modern-day marketing and advertising. The data and technology are now available to allow companies to create highly personalized and relevant experiences for their customers. However, the collection and use of data also raise concerns about privacy and trust.
This article will present a comprehensive overview of the latest marketing personalization statistics.
These charts provide insights into the spending on marketing data, the purposes of using intent data, the benefits of premium loyalty programs, the willingness to share data for personalized ads, the preferences for targeted advertising, and the level of concern about online data.
Table of Contents
U.S. Marketing Personalization Stats Overview
The use of customer experience personalization and optimization software and services is becoming increasingly popular and profitable in the technology industry.
The personalization stats in this section provide insight into the revenue growth of this market and the level of success that businesses have achieved in integrating personalization technology into their tech stacks. They paint a picture of a thriving industry with a clear trend toward personalized customer experiences.
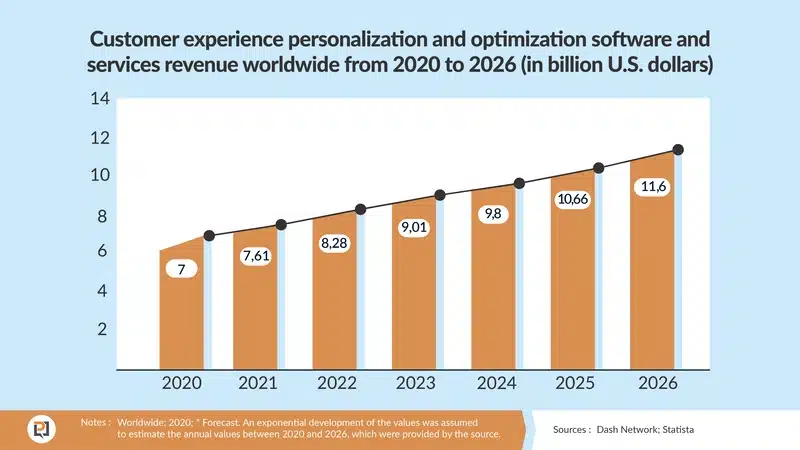
Global Revenue of Customer Experience Personalization and Optimization Software and Services Rises
The global revenue of customer experience personalization and optimization software and services was 7 billion US dollars in 2020 and is expected to reach 11.6 billion US dollars by 2026.
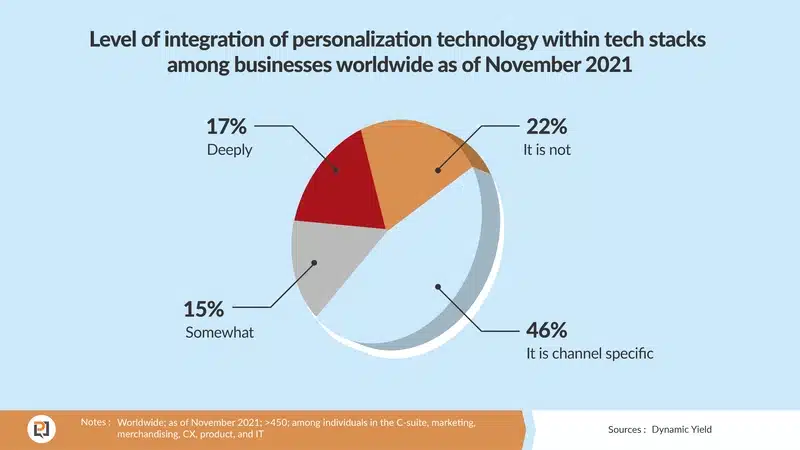
Level of Integration of Personalization Technology Among Businesses Worldwide
As of November 2021, 17% of businesses have deeply integrated personalization technology within their tech stacks.
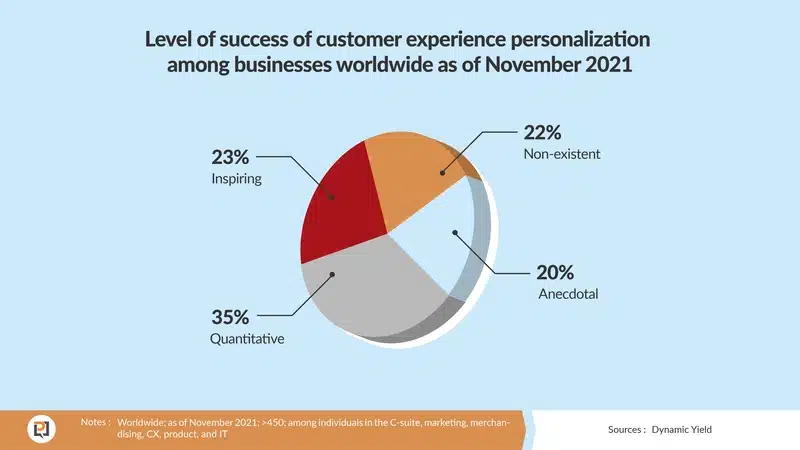
Level of Success of Customer Experience Personalization Among Businesses Worldwide
Also as of November 2021, 35% of businesses have achieved quantitative success in customer experience personalization.
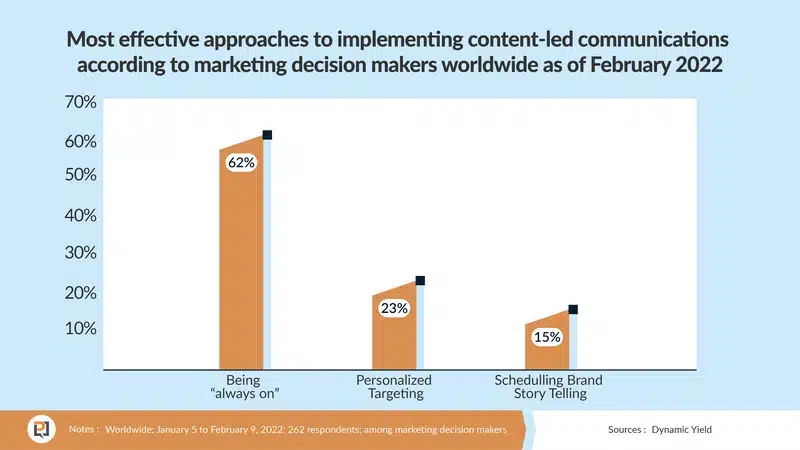
Personalized Targeting is an Effective Approach to Implementing Content-Led Communications
According to marketing decision-makers worldwide, the most effective approach to implementing content-led communications is being “always on” (62%) followed by personalized targeting (23%) and scheduling brand storytelling (15%).
Marketer Insights into Personalization
The following marketing personalization statistics provide insights into the priorities, technology deployments, personalization efforts, revenue trends, motivations, and perceptions of marketers in the United States. The information has been gathered from surveys of Chief Marketing Officers (CMOs), marketing decision-makers, and retail media networks conducted between August 2021 and September 2021.
The data provides a glimpse into the state of marketing and personalization in the US, highlighting the areas of focus, the impact of technology, and the challenges facing marketers. These statistics can be valuable to businesses and organizations in understanding the current marketing landscape and making informed decisions to stay ahead of the curve.
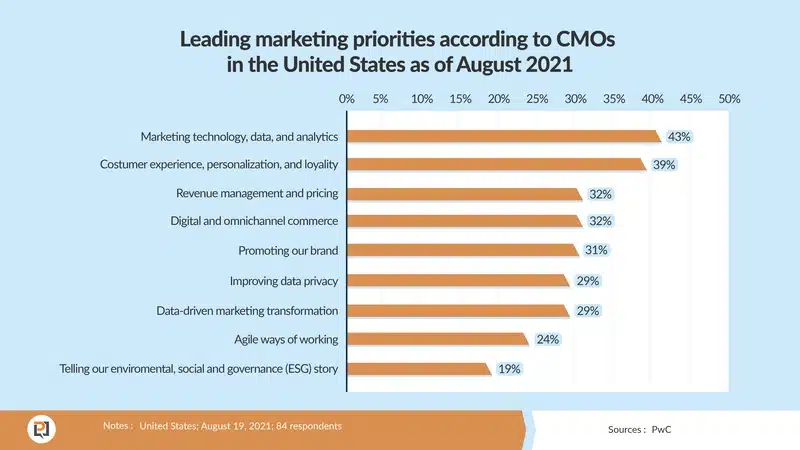
Marketing Technology, Data, and Analytics Are the Top Marketing Priorities for US CMOs
The top marketing priorities of CMOs in the US as of August 2021 are marketing technology, data, and analytics (43%), followed closely by customer experience, personalization, and loyalty (39%). Other priorities include revenue management and pricing (32%), digital and omnichannel commerce (32%), promoting the brand (31%), improving data privacy (29%), data-driven marketing transformation (29%), agile ways of working (24%), and telling the ESG story (19%).
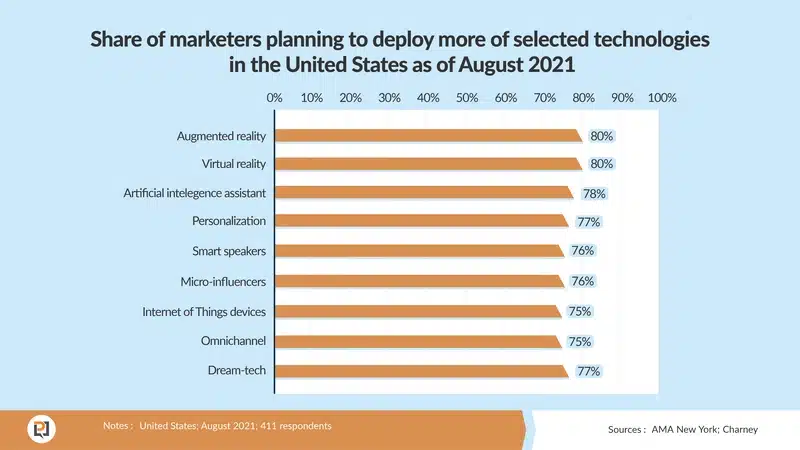
Most Marketers Plan to Deploy Personalization Technologies
The majority of marketers in the US plan to deploy more of the following technologies: augmented reality (80%), virtual reality (80%), artificial intelligence assistant (78%), personalization (77%), smart speakers (76%), micro-influencers (76%), Internet of Things devices (75%), omnichannel (75%), and dream-tech (77%).
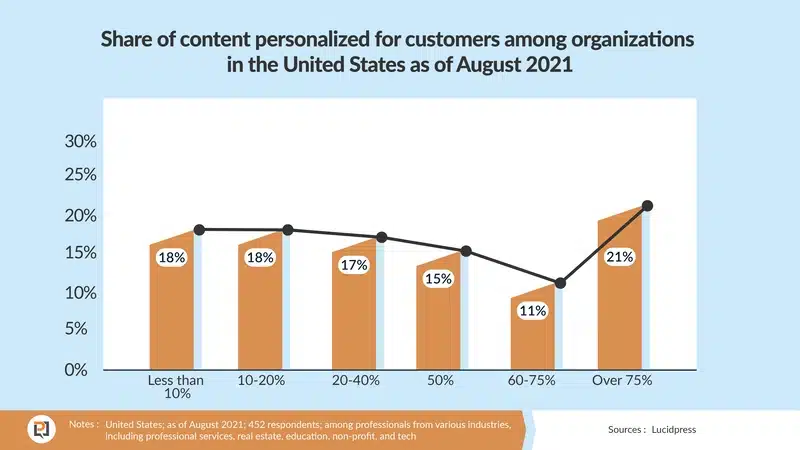
Over 20% of Content is Personalized
In the US, the majority of organizations have personalized less than 20% of their content (36% between 10-20% and 17% between 20-40%). 15% of organizations have personalized 50% of their content, while only 11% and 21% have personalized 60-75% and over 75% of their content, respectively.
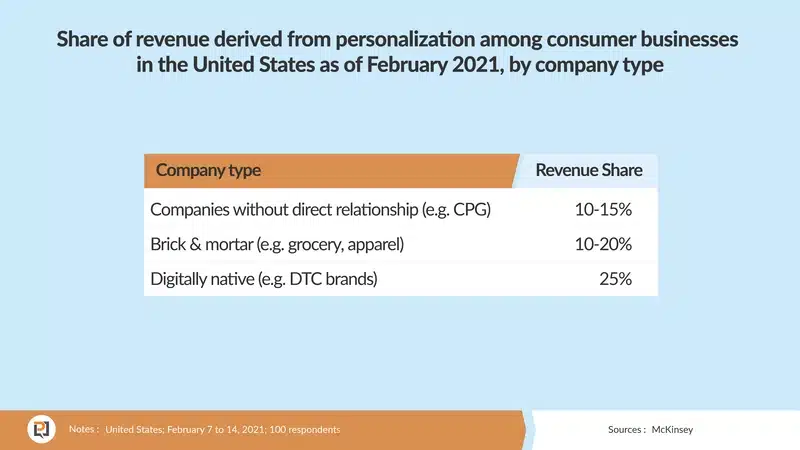
Up to 25% of Revenue is Derived from Personalization
In February 2021, companies without direct relationships, such as CPGs, derived 5-10% of their revenue from personalization. Brick & mortar companies, such as grocers and apparel brands, derived 10-20% of their revenue from personalization. Digitally native companies, such as DTC brands, derived 25% of their revenue from personalization.
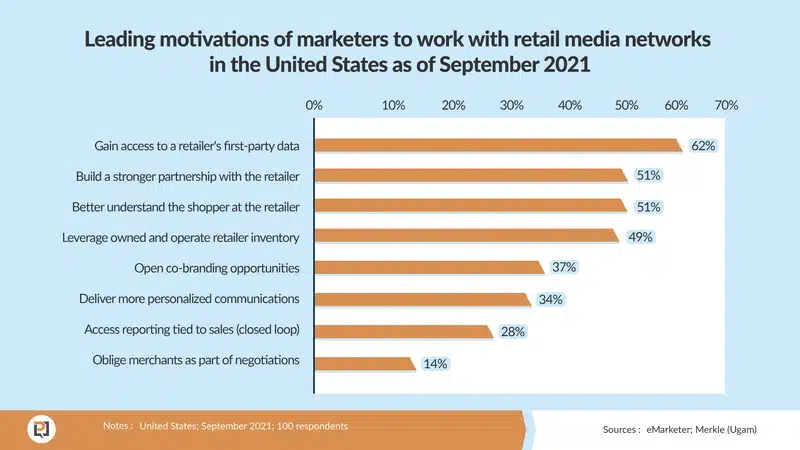
34% of Marketers Work with Retail Media Networks to Improve Personalization
Marketers in the US are motivated to work with retail media networks to gain access to a retailer’s first-party data (62%), build a stronger partnership with the retailer (51%), better understand the shopper at the retailer (51%), leverage owned and operated retailer inventory (49%), open co-branding opportunities (37%), deliver more personalized communications (34%), access reporting tied to sales (closed loop) (28%), and oblige merchants as part of negotiations (14%).
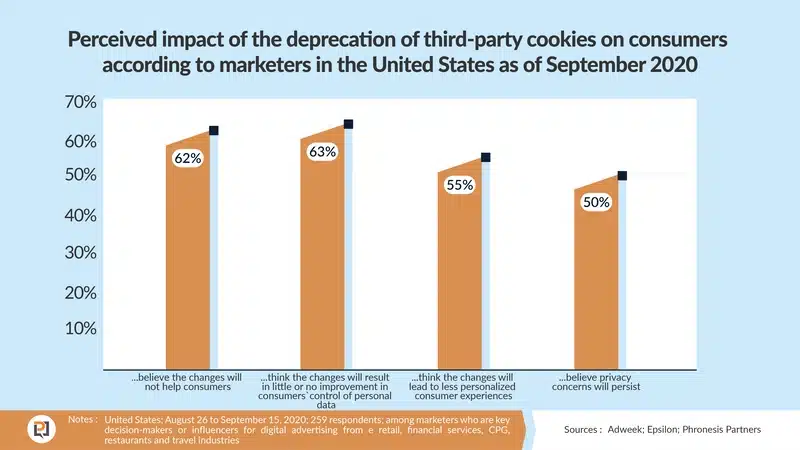
Deprecation of Third-Party Cookies Will Lead to Negative Results for Consumers
According to marketers in the US, the deprecation of third-party cookies will not help consumers (62%), will result in little or no improvement in consumers’ control of personal data (63%), will lead to less personalized consumer experiences (55%), and privacy concerns will persist (50%).
Consumer Insights into Personalization
The following statistics provide insights into consumer preferences and behaviors related to advertising in the United States as of March 2022 and prior.
The data covers various aspects of advertising such as consumer perception, preferred characteristics of ads, consumer engagement with personalized content, and consumer frustration with irrelevant and mistargeted advertising. The statistics also highlight the impact of generation, technology, and social media on consumer advertising preferences.
The data is collected from various sources and provides a comprehensive overview of consumer attitudes and behaviors toward advertising.
Perception of Advertising of Selected Products and Services in the US
This chart shows the perception of advertising for selected products and services in the United States as of March 2022. The data reveals that consumers have positive perceptions of ads for products and services that are highly relevant to their interests (54%), meet their needs (50%), or that they use or might use (46%).
On the other hand, consumers have negative perceptions of ads for products and services that are not related to them (52%). The results suggest that personalized advertising has a significant impact on the consumers’ perception of advertising.
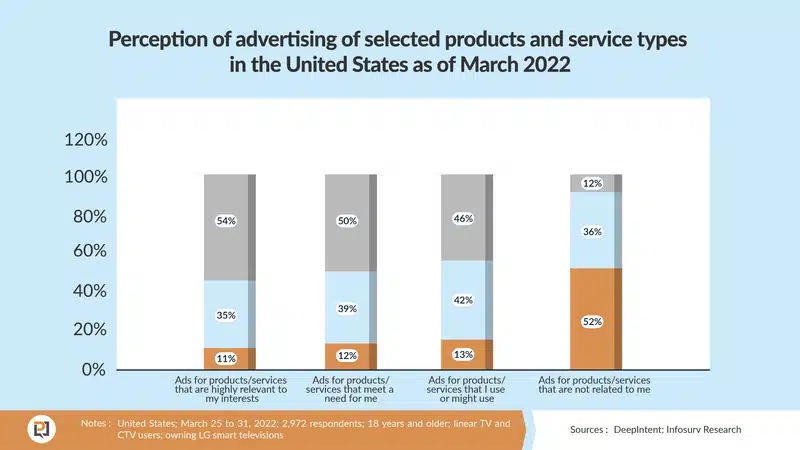
Orange: Dislike them; Blue: Neutral about them; Gray: Like them.
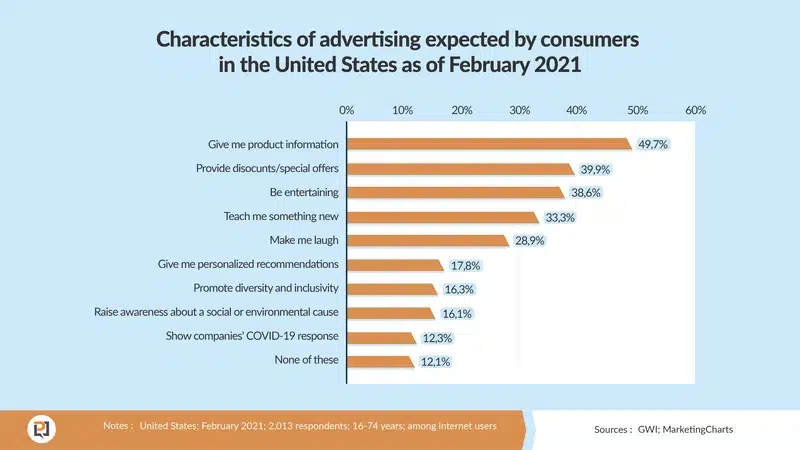
Characteristics of Advertising Expected by Consumers in the US
This chart shows the characteristics of advertising expected by consumers in the United States as of February 2021. According to the data, consumers expect advertising to provide product information (49.7%) and discounts/special offers (39.9%) more than any other characteristic.
Other characteristics like being entertaining (38.6%), teaching something new (33.3%), making them laugh (28.9%), providing personalized recommendations (17.8%), promoting diversity and inclusivity (16.3%), raising awareness about social or environmental issues (16.1%), or showing companies’ COVID-19 response (12.3%) are also expected by a considerable number of consumers.
The results suggest that consumers have diverse expectations from advertising and that companies need to be mindful of these expectations while creating their advertising campaigns.
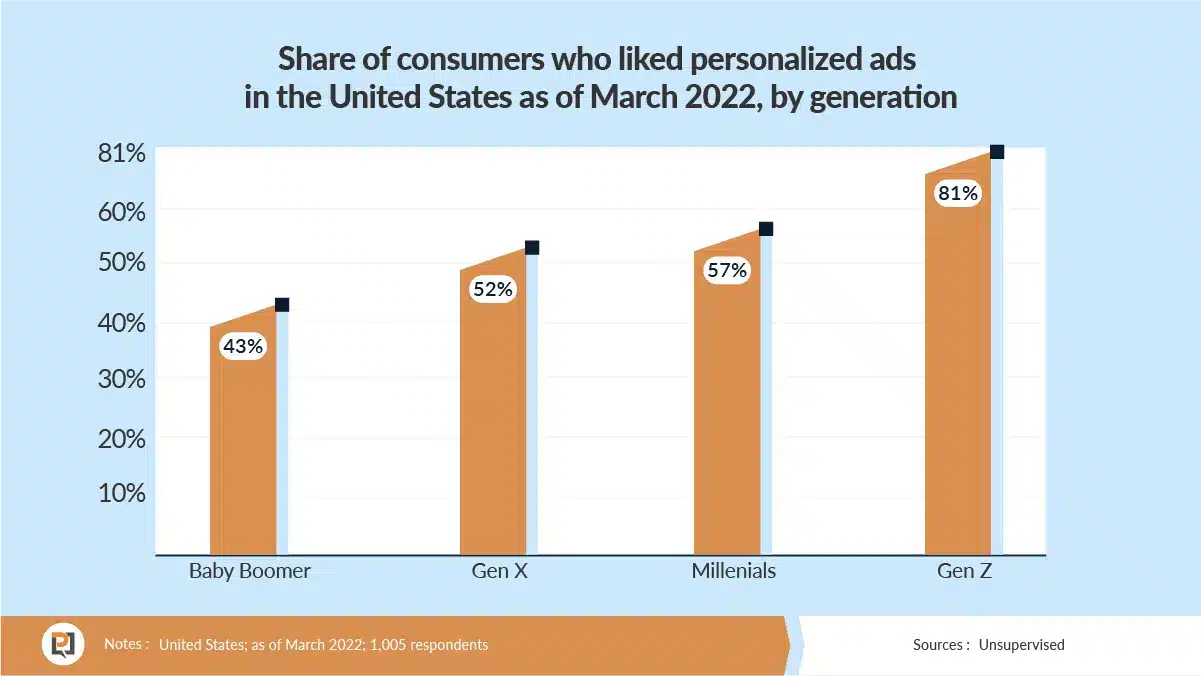
Over 80% of Gen Z in the US Likes Personalized Ads
This chart shows the share of consumers who liked personalized ads in the United States as of March 2022, by generation. The data reveals that the younger generations, Gen Z (81%) and Millennials (57%), have a higher preference for personalized ads compared to Baby Boomers (43%) and Gen X (52%).
The results indicate that companies should target their personalized advertising campaigns toward the younger generations as they have a higher likelihood of engaging with them.
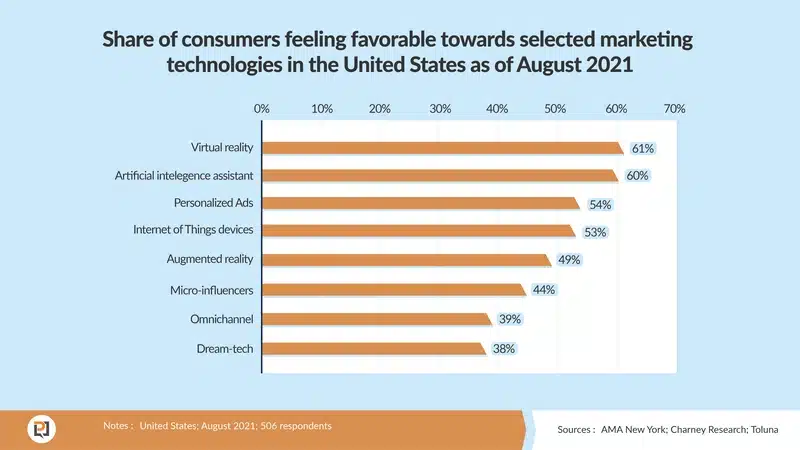
Most Consumers Feel Favorable Toward Personalized Ads
This chart shows the share of consumers feeling favorable toward selected marketing technologies in the United States as of August 2021. According to the data, virtual reality (61%) and artificial intelligence assistants (60%) are the two marketing technologies that have the most favorable impressions among consumers. Personalized ads (54%), internet of things devices (53%), and augmented reality (49%) are also well received by consumers.
The results suggest that companies should invest in virtual reality, artificial intelligence assistants, and personalized ads as they are likely to be well received by consumers.
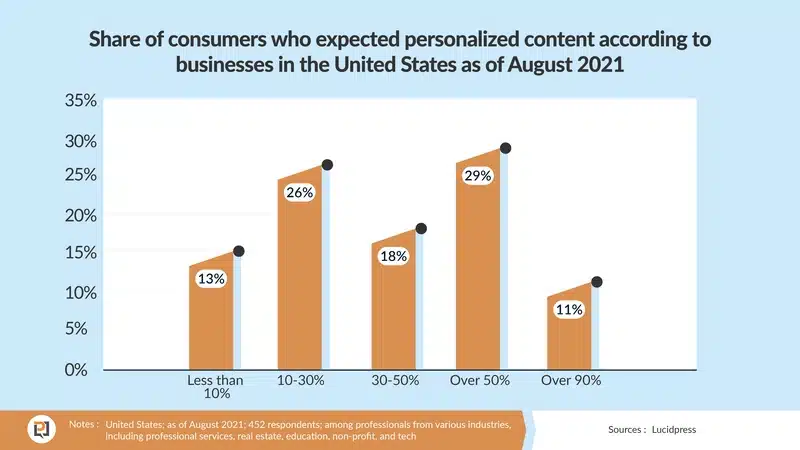
US Consumers Expect Personalized Content
This chart shows the share of consumers who expected personalized content according to businesses in the United States as of August 2021.
The data reveals that a considerable number of consumers expect businesses to provide personalized content, with 30-50% (18%) being the most common expectation. A smaller number of consumers expect less than 10% (13%) or over 90% (11%) of content to be personalized content.
The results suggest that companies should aim to provide personalized content because a significant portion of their audience will likely expect it.
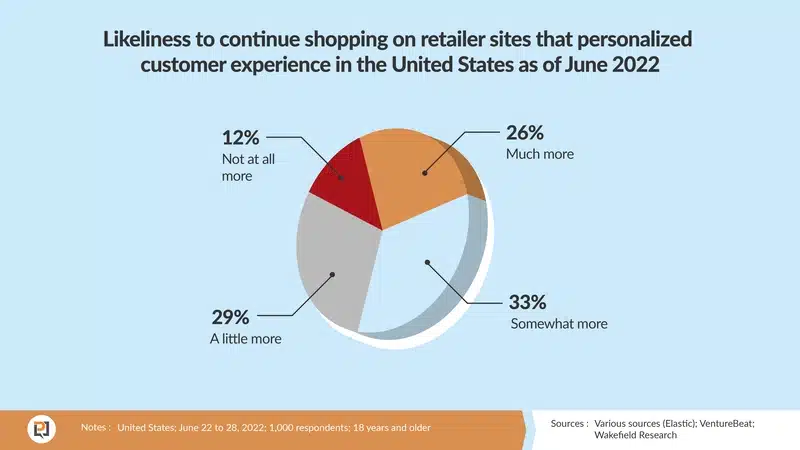
Personalized Customer Experience Increases Customers Likeliness to Continue Shopping
This chart shows the likelihood of consumers continuing to shop on retailer sites that have personalized their customer experience in the United States as of June 2022. According to the chart, 26% of consumers are much more likely to continue shopping on these sites, 33% are somewhat more likely, 29% are a little more likely, and 12% are not at all more likely.
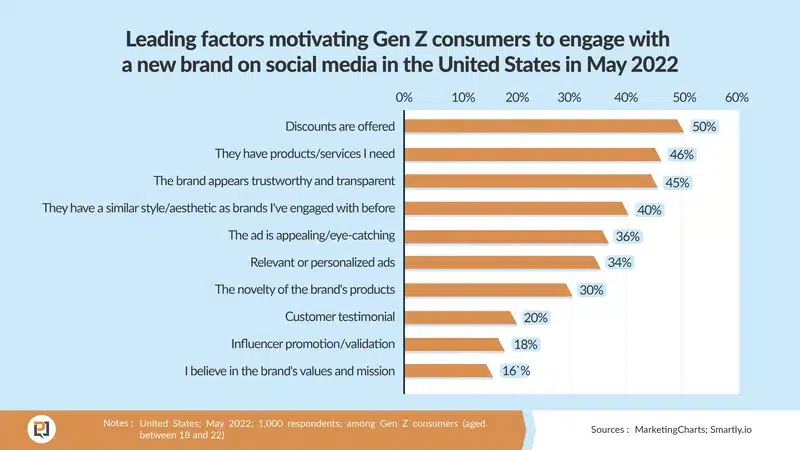
Discounts Are the Leading Motivator for Gen Z Consumers to Engage with a New Brand on Social
This chart shows the leading factors that motivate Gen Z consumers to engage with a new brand on social media in the United States as of May 2022.
The top factor is discounts offered (50%). That’s followed by having products/services they need (46%), and the brand appearing trustworthy and transparent (45%).
Other factors like having a similar style/aesthetic as other brands they’ve engaged with (40%), appealing or eye-catching ads (36%), and relevant or personalized ads (34%) also play a role in motivating Gen Z consumers to engage with new brands.
Customer testimonials (20%), influencer promotions/validations (18%), and belief in the brand’s values and mission (16%) are the least important factors.
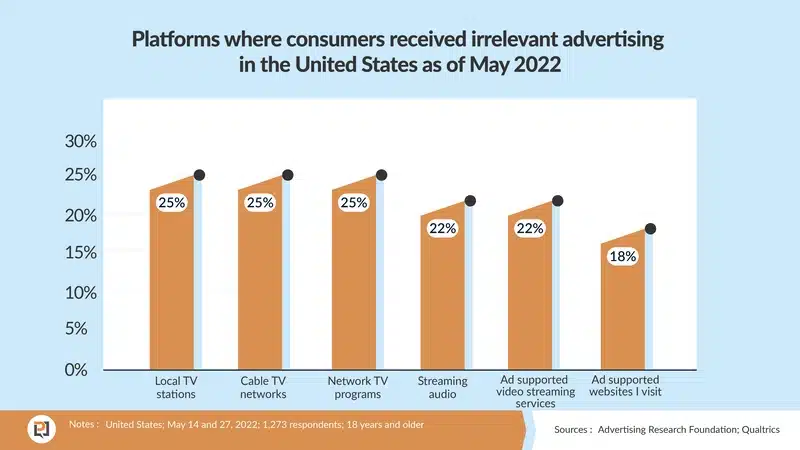
Platforms Where Consumers Received Irrelevant Advertising
This chart shows the platforms where consumers receive irrelevant advertising in the United States as of May 2022.
According to the chart, the top three platforms are local TV stations (25%), cable TV networks (25%), and network TV programs (25%).
Other platforms like streaming audio (22%), ad-supported video streaming services (22%), and ad-supported websites that consumers visit (18%) also play a role in delivering irrelevant advertising.
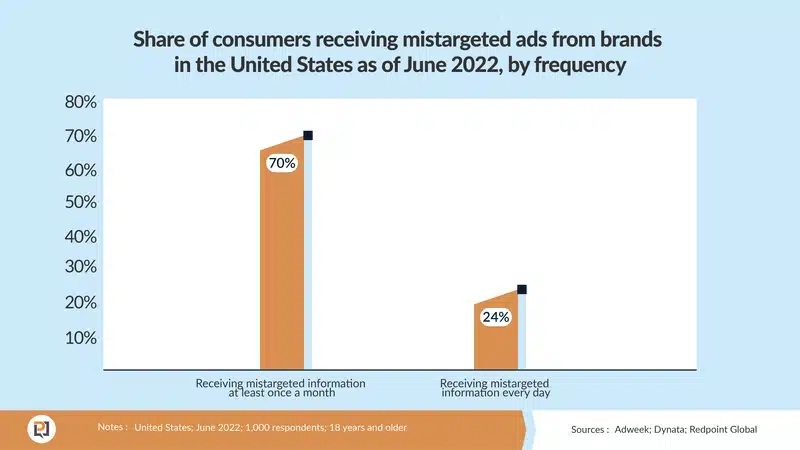
Most Consumers Are Still Receiving Poorly Targeted Ads
This chart shows the share of consumers who receive mistargeted ads from brands in the United States as of June 2022, based on frequency. According to the chart, 70% of consumers receive mistargeted information at least once a month, while 24% receive it every day.
Personalization Data Usage Statistics
These marketing personalization statistics provide insight into various aspects of consumer behavior and attitudes toward data, advertising, and loyalty programs in the United States and Canada.
The data highlights consumers’ perspectives on the purposes and benefits of using intent data, the types of information they are willing to share for personalized ads, the ways in which brands can improve trust through data, the incentives that motivate data sharing, the benefits of targeted advertising, and the level of concern about online data.
By understanding these attitudes and preferences, companies can make informed decisions on how they collect and use data to improve the customer experience and build trust.
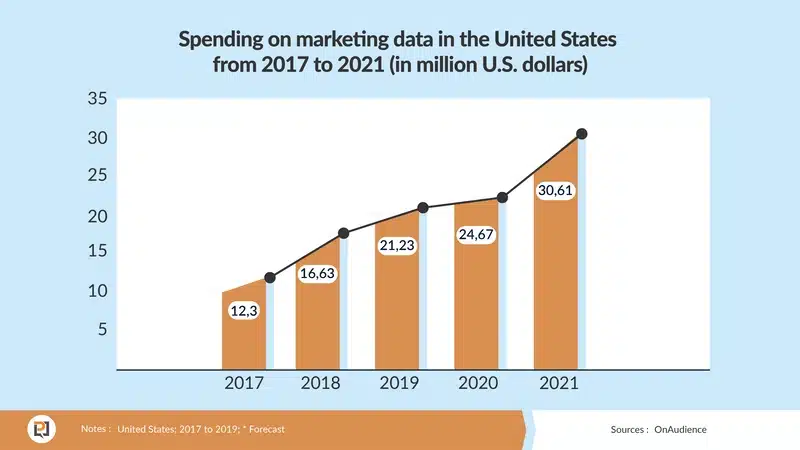
Marketing Data Spending Rises in the United States Paragraph
Marketing data spending in the United States has been increasing steadily over the past few years, reaching 30.61 million U.S. dollars in 2021. This is a significant increase from the 12.3 million U.S. dollars spent in 2017.
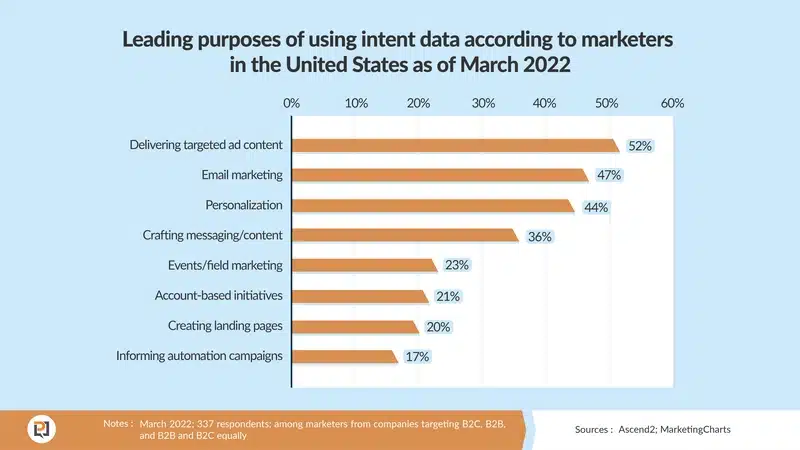
Delivering Targeted Ad Content is the Leading Purpose of Using Intent Data
Marketers in the United States use intent data for various purposes, with delivering targeted ad content being the most common. This is followed by email marketing and personalization. Crafting messaging and content, events and field marketing, and account-based initiatives are also among the leading purposes of using intent data.
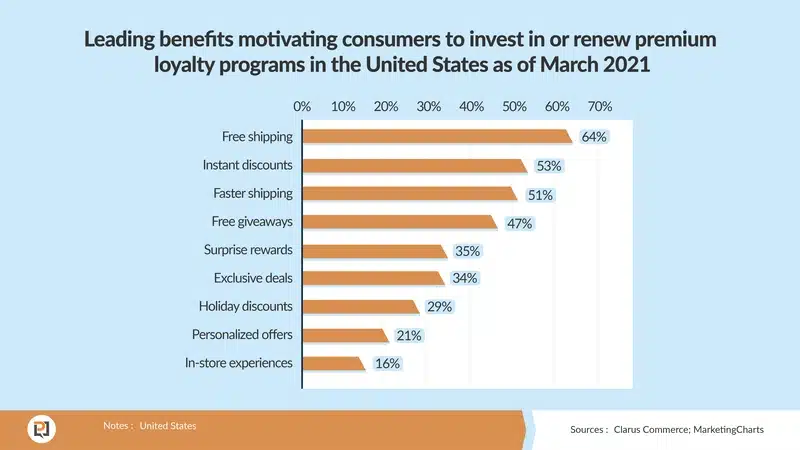
Free Shipping is the Leading Benefit for Consumers Investing in Loyalty Programs
Consumers in the United States are motivated to invest in loyalty programs due to the benefits they offer. The leading benefit is free shipping, followed by instant discounts and faster shipping. Free giveaways, surprise rewards, exclusive deals, holiday discounts, personalized offers, and in-store experiences are also among the benefits that motivate consumers to invest in loyalty programs.
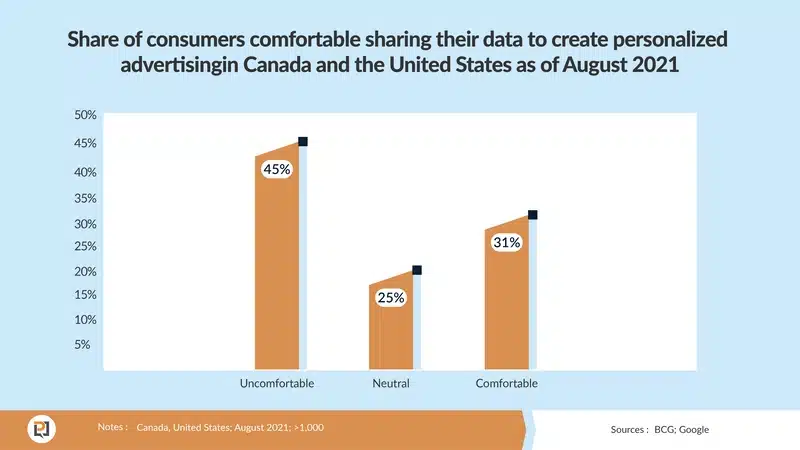
Majority of Consumers Accept Sharing Data for Personalized Advertising
A large proportion of consumers in Canada and the United States are uncomfortable with sharing their data to create personalized advertising (45%). But 31% of consumers are comfortable with sharing their data and 25% are neutral.
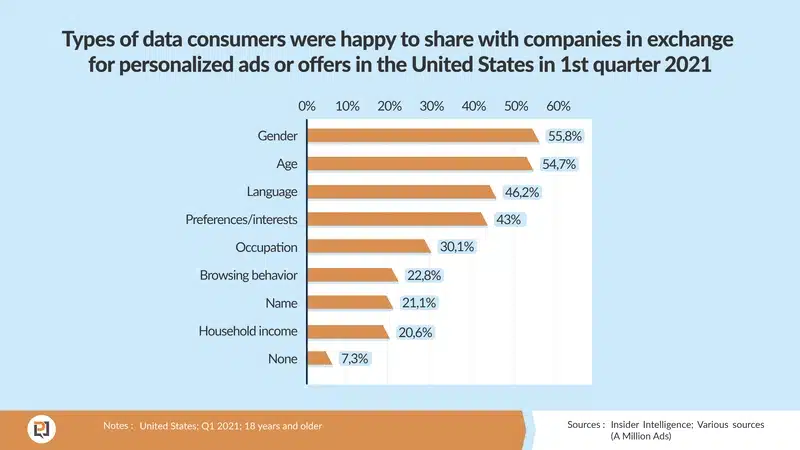
Gender and Age are the Most Acceptable Data Types to Share for Personalized Ads
Consumers in the United States are willing to share certain types of data in exchange for personalized ads or offers. The most acceptable data types are gender and age, followed by language, preferences and interests, occupation, and browsing behavior.
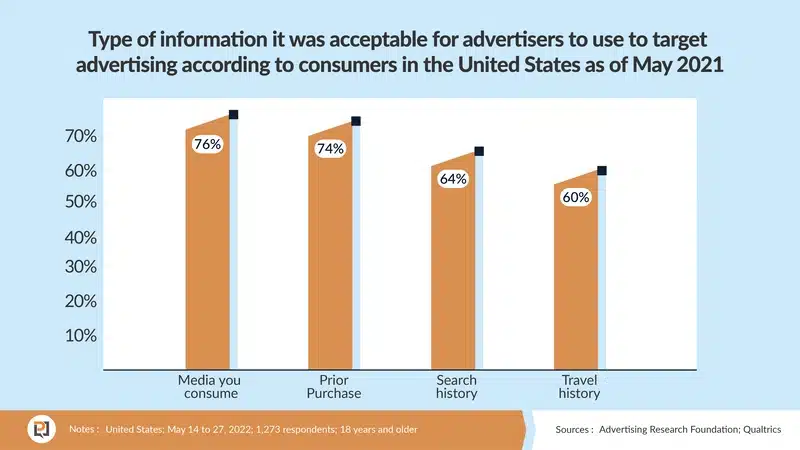
Media Consumption is the Most Acceptable Data Type for Ad Targeting
Consumers in the United States have varying opinions on what data types are acceptable for advertisers to use for targeting advertising. The most acceptable data type is media consumption, followed by prior purchases, search history, and travel history.
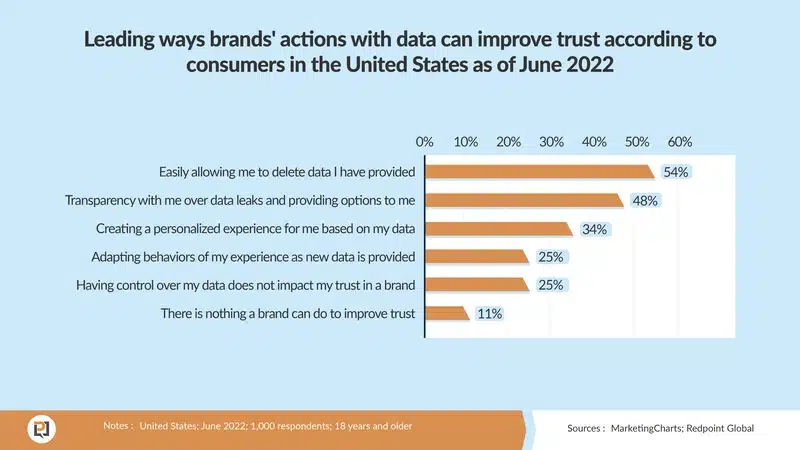
Allowing Data Deletion is the Leading Way for Brands to Improve Trust with Data
Consumers in the United States have different opinions on the ways brands can improve trust with their data. The leading way is by allowing easily allowing data deletion, followed by transparency over data leaks and providing options to the consumers. Personalized experiences and adapting behaviors are also among the ways brands can improve trust with their data.
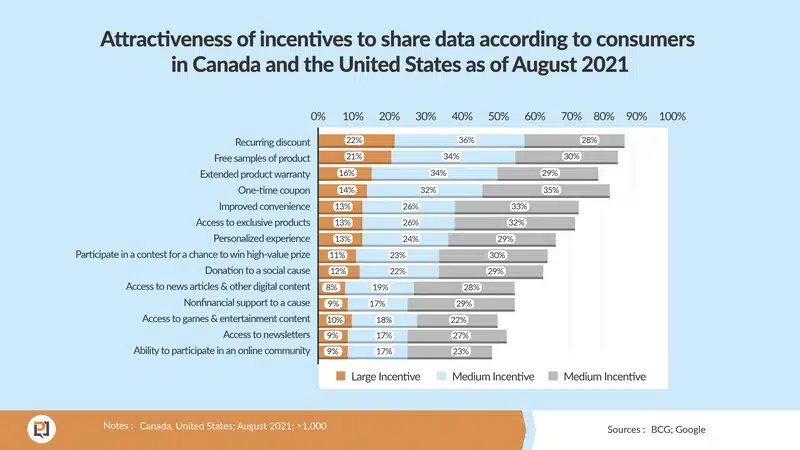
Large Incentives are the Most Attractive for Consumers to Share Data
Consumers in Canada and the United States are attracted to different types of incentives to share their data. The most attractive incentives are large incentives, followed by medium and small incentives. Recurring discounts, free samples of products, and extended product warranty are among the most attractive incentives.
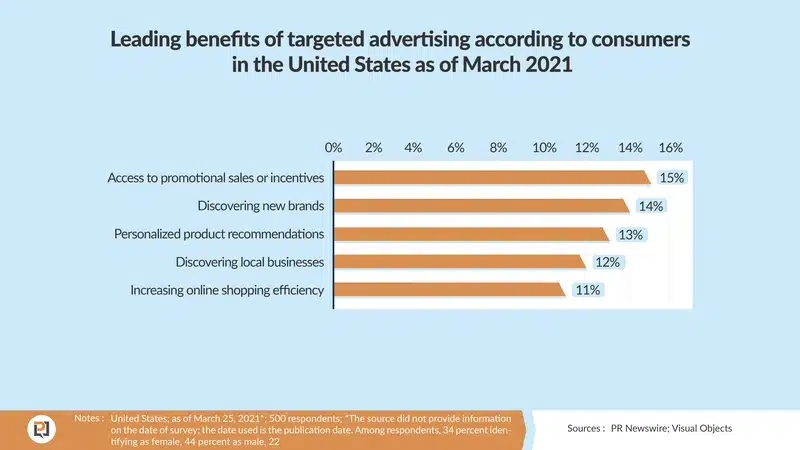
Access to Promotional Sales and Incentives is the Leading Benefit of Targeted Advertising
Consumers in the United States see various benefits of targeted advertising, with access to promotional sales and incentives being the most popular benefit, followed closely by discovering new brands.
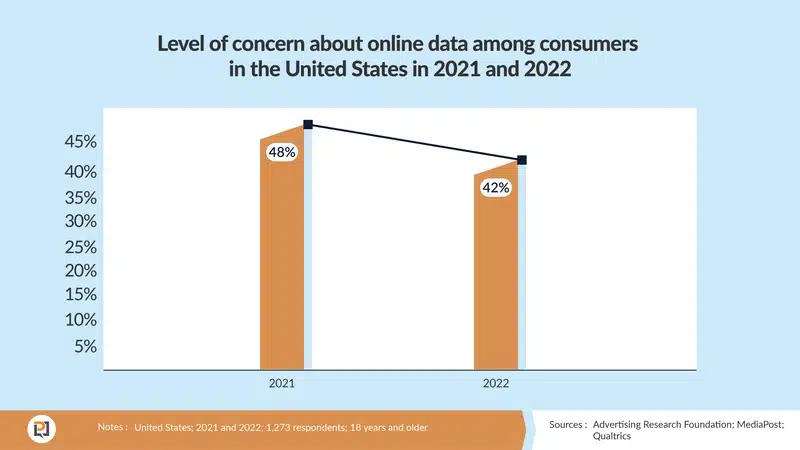
Consumers’ Concern About Online Data Decreases in 2022
According to the data, the level of concern about online data among consumers in the United States decreased from 48% in 2021 to 42% in 2022.
This suggests that there has been an improvement in consumers’ confidence in the handling of their online data by companies or other entities.
It is important for companies to continue to prioritize transparency and security in the handling of personal information to maintain or further increase consumer trust.
Marketers Must Prioritize Personalization
The data presented in this article offers a comprehensive picture of consumer attitudes and behaviors toward data, marketing, and loyalty programs in the United States. It’s clear that personalization is on the rise and that marketers who don’t make it a priority will be left behind.